
It has been almost two months now that Bitcoin has been trading within a noticeably flat range between $6100 and $6800. September 5 was the last time price really showed any volatility. That was when it retraced from a then lower high of $7400. Disregarding the freak pump on 15 October which was purely Tether FUD (fear, uncertainty and doubt), price has been probably the flattest it has been all year. And on top of that, we are currently seeing the lowest investor or trader volume all year too. The 2018 annual low is not far below us, around $5800 so we are hovering in shallow waters now, with not a breeze in sight to lift our sails. What does it mean and where might it lead us?
The all time high of December 2017 was a dizzying experience at a stratospheric $20000. You could almost touch the moon, or so it seemed at the time. Since then price has only ever dropped to $6000 or below on about 6 days so far this year, in February, June and August. Yet now it hovers for the past two months in the lower $6000s. On a positive note it shows consolidation if nothing else. At least we are not going any lower any more. Price seems to have found its stable bottom in its 2018 retracement. Basically we have dropped around 70% since the $20k ATH (all time high) and would need to triple in price or rise up 200% from current levels to see that ATH again. It sounds like an insurmountable hurdle, especially when some analysts are saying that there is a likelihood that price will drop still further, possibly to around $5000 (give or take $500).
Bad as it may sound, we need to look at previous price history of Bitcoin and its historic crashes or retracements throughout the past 9 years or so to really put this in perspective and see that it is not unusual and can be overcome. Firstly, Bitcoin’s last major bull run started on 11 November 2017 at a price of $5400, so we are still above that. And technically in order to make a huge leap upward, price generally crouches down to get some added spring in its leap, like a jumper, before bouncing up that extra step. So dropping a little lower to the support level of $5400 would be completely normal in order for Bitcoin to get some spring in its leap up. That is how I’ve seen bounces to the upside work in the past. A sudden drop immediately precedes many a major pump upwards.
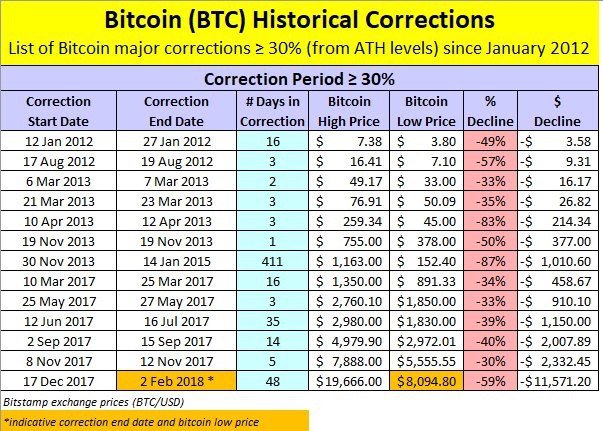
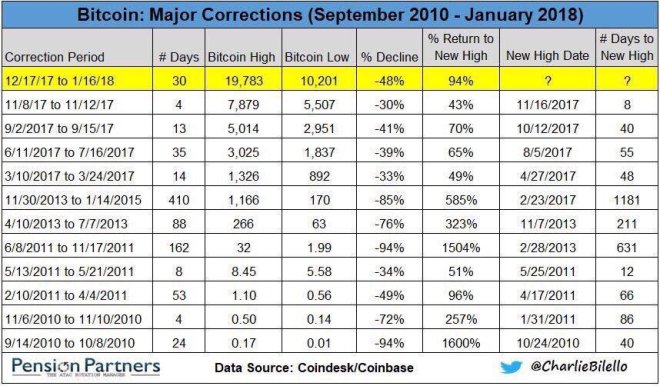
If we look back still further to a similar retracement that we had from November 2013 until January 2015, we can see then that price also fell around 85%. That bear market lasted 410 days, longer than our current 2018 slump of over 300 days at his point. Then there was the crash of April to July 2013that lasted 88 days as price fell 76%. Preceding that was the 2011 bear phase from June to November that lasted 162 days and retraced 94%. That one required a massive 1500% in order to return to the then higher high, but return we did, as Bitcoin’s price seems to do every time. So why should this time be any different? Basically it shouldn’t.
The longest bear market so far was the now famous 2014 event, and although it lasted 410 days, it actually took a total of 1181 days until the next ATH. Therefore we should consider ourselves currently to be somewhere in the middle of this present retracement. We have reached the low point or thereabouts, by the looks of the price stabilization just above $6000. Price has retraced and capitulated. Now it stabilizes and accumulation can set in, where people and especially big investors buy in once more. Those experts that sold near the ATH around $20000 have been waiting on the sidelines all this time for the right moment to buy back in. Big investors are also waiting for an ideal low point to buy in for the long term. They will all start reinvesting around now. Volume is low because big investors don’t buy on the exchanges where volume can be measured. They buy behind the scenes OTC (over the counter) so we don’t see their volume showing up to be included in measurements. As a result volume seems lower than ever only because small retail investors like us have been exhausted or have actually lost interest in reinvesting or buying in. Also, it is particularly risky to attempt to day trade these current market conditions. It’s like trying to paddle out and surf some waves when the sea is flat. Even more, because nobody knows – not even experts – which way current price is going to break, it is really risky now to trade. Price could just as well dive lower as pump upward at this point. Conditions are simply not favourable to do any trading and so volume is at a record low for the year.
Nevertheless, even by doing nothing, Bitcoin price is showing something. It’s showing us stability, as if it has reached a bottom for now. All that is left is a final dip to $5500 or thereabouts and then a leap up, ideally above $6800 or more importantly even above $8000 to really indicate a decent bull run has arrived. Of course price does not move in a straight line and there will be ups and downs along the way. As long as we start printing higher highs and higher lows, we can be sure the long awaited bull run has arrived. Analysts are all calling for the fourth quarter as the traditional bull run time (Oct-Dec), especially based on historical presidents like in 2017, and 2016 (Nov particularly), 2015 and 2014 to degree, where again particularly in November price climbed around 70%, (but did then retrace soon after). So we may not see ATHs above $20000 for a while yet, perhaps if we’re lucky another six months to a year, but we can at least begin to see some semblance of a return to positive price movement and a more attractive trading field in the coming month, if history is anything to go by. But then nobody really knows for sure with Bitcoin. If however price does start showing signs of life, we can be sure that the altcoins will start pumping even further, something which some say is already starting to manifest. So these are times of intense anticipation for traders and it helps to have some insight from more experienced technical analysts as to the conditions and eventual turn of the tide.
What are your thoughts on Bitcoin’s price possibilities? Will it go to $250 000 as Novogratz, Mcafee and Max Keiser say it will? We can only hope. I would like to believe the odds are on our side. Because if it does it will take all the altcoins with it and history will be made once more, where Bitcoin makes dreams come true and fantasies a reality. Watch that price graph on www.tradingview.com and see it all unfold before your eyes.
